Recently one of my Windows Phone app had a crash and it was available for download in crash count on WP Dev Center. Crash count had an excel file containing links for .CAB file which can be downloaded and we can extract the .CAB file to get the dump file containing stack traces.
We have to use WinDBG which is a free debugging tool from Microsoft. Following are the steps which need to be performed to get the exception details and stack traces.
- Download Cab File and extract mdmp file
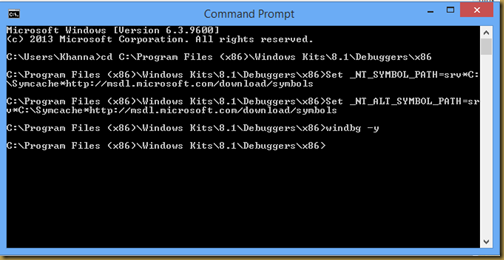
- As you can see in above image we have set symbol path as environment variable. We have set “http://msdl.microsoft.com/download/symbols” path which is a link for Microsoft Symbol Server.
- Open WinDBG using "WinDBG -y" command
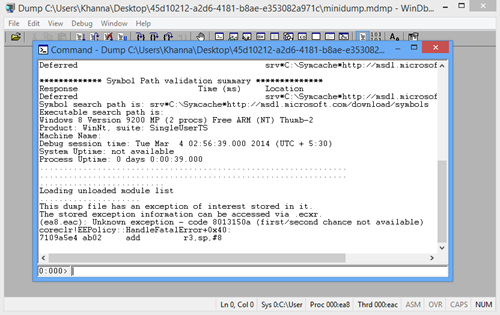
- As you can see in above image you get a command line at bottom of screen with text “0.000>”.
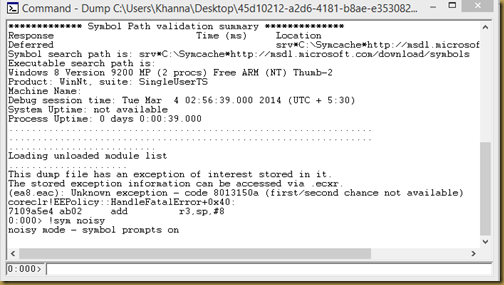
- Turn on the noisy symbol loading mode using “!sym noisy” command. This command instructs the debugger to display information about its search for symbols.You can find more about this command from following link
0.000> !sym noisy
- Use .reload command to delete all symbol information for the specified module and reload these symbols as needed. Using “/f” parameter with .reload command will force the debugger to load the symbols immediately.
0.000> .reload /f
You can know more about this command from following link
http://msdn.microsoft.com/en-us/library/windows/hardware/ff564805(v=vs.85).aspx
- Use “KV” command to get stack frame information. It displays frame pointer omission (FPO) information.
0.000> kv
You can find more about this command from following link
http://msdn.microsoft.com/en-us/library/windows/hardware/ff551943(v=vs.85).aspx
- Use “!analyze –v” to get information about current exception or bug check with verbose output.
0.000> !analyze -v
You can find more about this command from following link
http://msdn.microsoft.com/en-us/library/windows/hardware/ff562112(v=vs.85).aspx
Hope above steps helps you finding exception information from dump file available in Dev Center.
Special thanks to Bret Bentzinger and Eric Dunaway for providing lots of valuable input on the debugging process
Other Useful link
http://blogs.msdn.com/b/wsdevsol/archive/2013/08/15/dump-diving-into-cert-failure_3a00_--how-to-get-a-good-callstack-from-triagedump.dmp.aspx
Other Useful link
http://blogs.msdn.com/b/wsdevsol/archive/2013/08/15/dump-diving-into-cert-failure_3a00_--how-to-get-a-good-callstack-from-triagedump.dmp.aspx


No comments:
Post a Comment